CRM Dashboards: 5 Sales Metrics Uzbek Owners Should Watch
Confused by your CRM dashboard? Here are the 5 CRM sales dashboard metrics Uzbek business owners actually need to track — and how to read them.

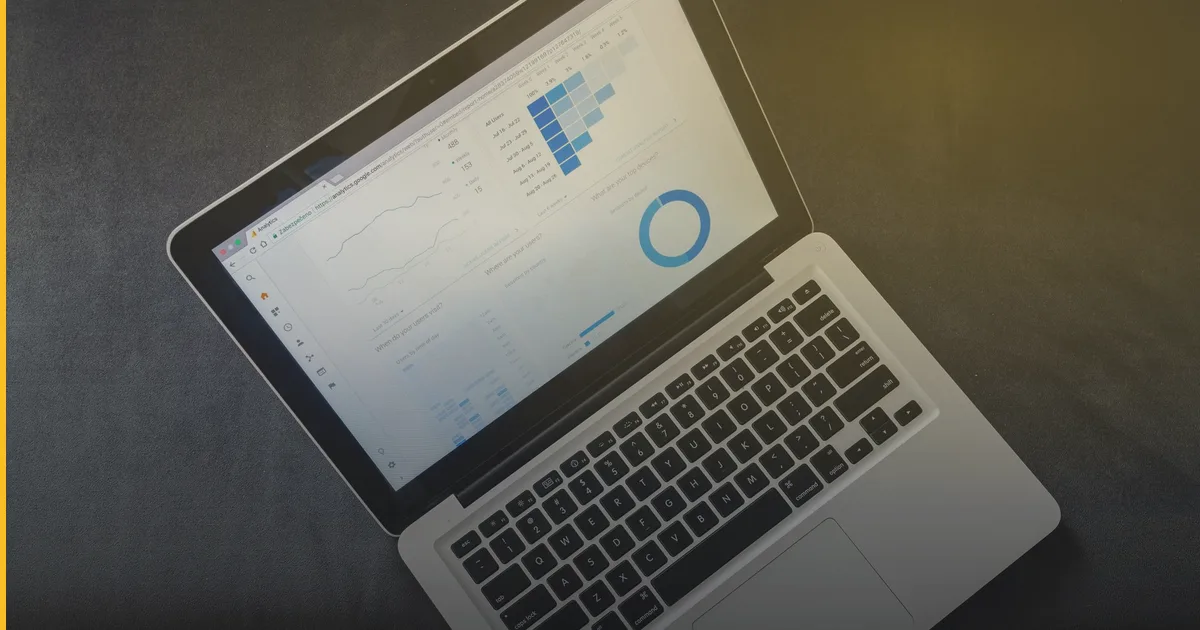
You installed amoCRM or Bitrix24 months ago. Your managers log calls, deals move through stages, and the dashboard is full of colourful charts — but you still can’t say, with confidence, whether sales are actually improving. That gap between “having a CRM” and “using CRM data to make decisions” is where most Tashkent businesses get stuck.
The fix isn’t more charts. It’s watching the right CRM sales dashboard metrics — a short list of numbers that tell you exactly where deals stall, which managers convert, and where money is being left on the table. This guide walks through the five that matter most for a typical Uzbek small or mid-size business, plus how to set them up without drowning in reports.
Why Most CRM Dashboards Go Unused
Out of the box, amoCRM and Bitrix24 show dozens of widgets: tasks completed, calls made, deals by source. Useful, but overwhelming. A manager glancing at the dashboard once a week doesn’t need forty numbers — they need five that map directly to revenue.
Businesses that get real value from CRM (the kind of setup that, in market patterns, correlates with roughly 30% higher sales) usually strip their dashboard down to a handful of metrics reviewed daily or weekly, not a wall of charts nobody opens.
1. Lead-to-Deal Conversion Rate
This is the percentage of incoming leads (from your website, Telegram bot, Instagram, or phone) that turn into a paying deal. If you’re running a Telegram-first business — and in Uzbekistan, with Telegram reaching roughly 76% of internet users, most inbound traffic now starts there — this number tells you whether your bot and sales team are actually closing what comes in.
Track it by source. A Telegram bot lead and a walk-in lead convert very differently, and blending them hides the real picture. If you’re still deciding how leads should even reach your CRM, our guide on how to automate your sales funnel with CRM and AI covers the routing logic in detail.
2. Average Deal Cycle Time
How many days pass between “lead created” and “deal won or lost”? A cycle stuck at three weeks when your product should close in three days is usually a process problem, not a demand problem — someone isn’t following up, or a stage in the pipeline has no owner.
Where cycles usually break
- No automatic reminder when a deal sits untouched for 48+ hours
- Manager forgets to move the deal stage after a client reply
- Payment step (Payme or Click) has no confirmation trigger back into CRM
- Deal has no clear next action assigned
Each unchecked box above is typically a few hours of CRM automation work, not a re-hire.
3. Deal Value by Stage (Pipeline Health)
This metric shows how much money is currently sitting in each pipeline stage — “New,” “Negotiation,” “Invoice Sent,” “Won.” A healthy pipeline looks like a funnel: more value at the top, less (but converting) toward the bottom. If most of your deal value is stuck in “Negotiation” for weeks, that’s your bottleneck, not your top-of-funnel.
| Stage | Healthy sign | Warning sign |
|---|---|---|
| New | Steady inflow daily | Spikes then silence for days |
| In Progress | Deals moving within 3–5 days | Deals sitting 2+ weeks |
| Invoice Sent | Payment confirmed within 48h | No Payme/Click confirmation logged |
| Won | Value trending up monthly | Flat or declining |
4. Manager-Level Performance
Aggregate dashboards hide individual performance. One manager might close 40% of assigned leads while another closes 10% — and without a per-manager view, that gap stays invisible until revenue is already down. Good CRM setups surface: number of deals owned, average response time, and win rate, per person, refreshed weekly.
This is also where AI-assisted CRM setups tend to show up in market data — sales teams using AI-supported CRM workflows report being roughly 40% more efficient on lead follow-up and prioritisation, simply because reps stop guessing which lead to call next.
5. Repeat Customer Rate
New leads get the attention; repeat customers get forgotten inside the same pipeline used for cold leads. Track what percentage of this month’s revenue came from clients who’ve bought before. For retail, service, and food-delivery businesses across Tashkent and Samarqand, repeat customers are usually cheaper to convert and higher margin — but only if your CRM actually tags and re-engages them, often via a Telegram broadcast or a manager task, instead of losing them in the noise.
How Often Should You Actually Review These Numbers
Daily is too much noise for most owners; monthly is too slow to catch a problem before it costs real money. A weekly rhythm works best for most Uzbek small and mid-size businesses: fifteen minutes every Monday morning, walking through the five metrics above with whoever owns sales. Write down one thing that changed and one action you’ll take because of it — that habit alone tends to matter more than any dashboard design choice.
It also helps to separate “watching” from “acting.” A metric moving the wrong way should trigger a specific next step — a manager conversation, a pipeline stage fix, a Telegram broadcast to lapsed customers — not just a note that things look worse this week.
Choosing the Right CRM for Dashboard Depth
Not every CRM makes these five metrics equally easy to see. If you’re still comparing platforms, our detailed breakdown of amoCRM vs Bitrix24 for Uzbek businesses and the fuller CRM integration guide for Uzbekistan walk through which platform fits which business size and workflow.
Cost is often the real blocker to setting dashboards up properly — teams assume a full CRM rebuild is required. It usually isn’t; see our post on how much CRM implementation actually costs in Uzbekistan for realistic ranges before you budget.
Frequently Asked Questions
Do I need custom development to see these metrics, or does amoCRM show them by default? amoCRM and Bitrix24 show most of the raw data out of the box, but the five metrics above usually require custom reports, funnel configuration, or a connected dashboard — typically a scoped project rather than a full rebuild.
How much does it cost to set up a proper CRM dashboard in Uzbekistan? Small configuration and reporting work often falls in the 1 500 000–5 000 000 so’m range; a fuller CRM-plus-AI-agent setup with automated dashboards typically starts from 5 000 000 so’m, depending on integrations (Telegram, Payme, Click).
Can I connect Telegram bot leads directly into these dashboard metrics? Yes — this is one of the most common Fera Tech project shapes: a Telegram ordering or lead bot feeding directly into amoCRM or Bitrix24, so lead source, conversion, and cycle time all populate automatically.
What’s the single metric to start with if I only track one? Lead-to-deal conversion rate by source. It’s the fastest way to see whether marketing spend and Telegram traffic are actually turning into revenue.
If your dashboard is full of numbers but short on answers, it’s usually a configuration gap, not a CRM problem. Explore our CRM and automation services or see recent client work, and get in touch to talk through what a proper CRM dashboard would look like for your business.
Building something like this?
Fera Tech ships iOS & full-stack apps end-to-end. Tell us about your project.
Start a project